Ice599: 3 x P-drop f.g. ice I + 3% by vol 1-micron Al2O3
Should be more or less a perfect twin of 595; both came from the same 3x P-drop sample
| Conditions: all steps P = 50 MPa | |
| T = 200 K, s = 6.8 MPa | step (1) |
| T = 200 K, s = 10.2 MPa | step (2a), (2b) |
| T = 200 K, s = 4.45 MPa | step (3a), (3b) |
| T = 200 K, s = 6.8 MPa | step (4) |
| T = 200 K, s = 10.2 MPa | step (5) |
|
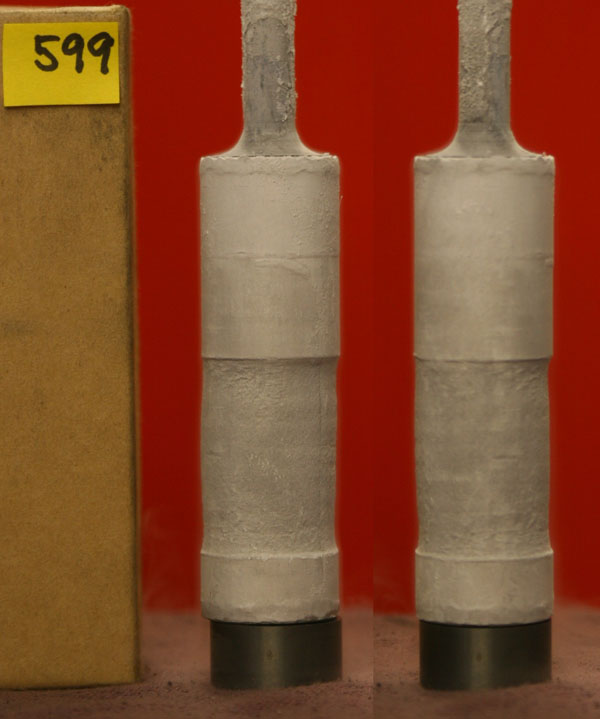
599 after (one fine looking sample, you have to admit) |
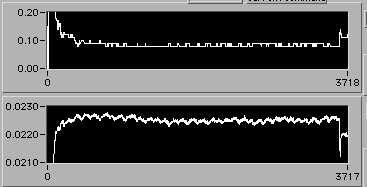
Legend: Upper graph of each pair is motor speed V (proportional to edot); lower graph is load (in volts). Translate motor V to edot thus: for 100:1 gearing, V0.05 ≈ 3e-8/s; for 10:1 gearing, V0.05≈3e-7/s. Load to stress translation for ice599 is 0.261 MPa/mV, with a ~5 mV zero offset. Horizontal scale is time. 5000≈14 hrs. |
||
.png) |
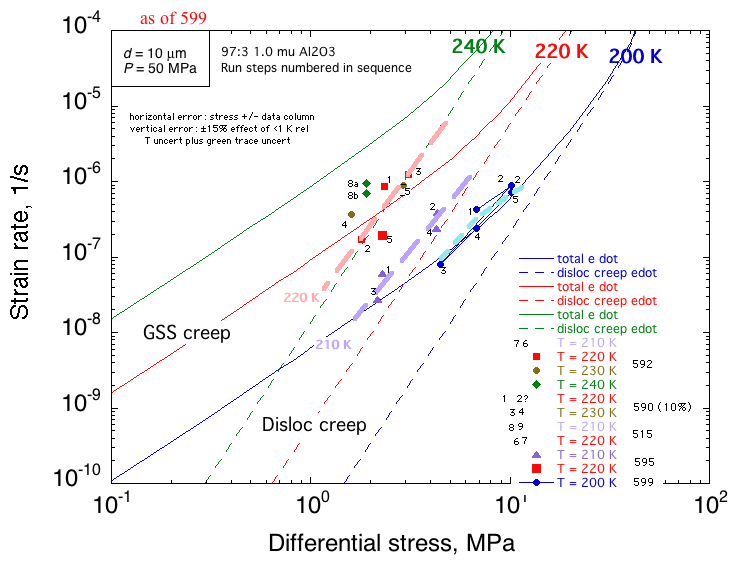
e=0.1735 | 0619 hrs 5/11. To end of run. To complete the summary several panes below: for the 5 steps the s sequence was 1:1.5:0.67:1:1.5 and the end of run edots were 4:9:1:2.3:6. Expect a working plot sometime in the near future. |
.png) |
e=0.1585 | 2235 hrs 5/10. Step 5 continues. |
.png) |
e=0.1432 | 1500 hrs 5/10. Start of step (5), a repeat of step (2) looking into this strain hardening thing. 10:1 gearing back in. Motor currently ~V0.075 vs ~0.09 at end of step (2), so flattens out the "knee" somewhat. Deconvoluting an n change while there is work hardening will be tricky. Surely will be the last step of the run, unless something untoward happens. |
.png) |
e=0.1348 | 1139 hrs 5/10. End of step (4). Displacement rate has fallen to barely half of what it was in step (1). Strain hardening? |
.png) |
e=0.1238 | 2051 hrs 5/9. Start of step (4), a repeat of step (1). Displacement rate is significantly slower than in step (1)... |
 |
e=0.1148 | 2217 hrs 5/8. Entirety of step (3b). Looks sort of like (3a). Force gage might have gotten kicked there at the end, a bit late at night to rezero and start up again. So stop step 12 hrs prematurely and let it rest for a while. |
.png) |
e=0.1109 | 1059 hrs 5/8. End of step (3a). |
.png) |
e=0.1097 | 0715 hrs 5/8. ~steady at V0.105. Current plan: run step (3) for another day, just to get the strain up. Then repeat step (1) for another 5 %. If no overall e dependence is confirmed, call it a run and save the sample as a pure 200 K CSEM sample. |
.png) |
e=0.1056 | 1921 hrs 5/7. |
.png) |
e=0.1020 | 1000 hrs 5/7. Step (3a) continues. Poor choice of T control parameters overnight caused that interesting resonance (homework problem: is there a way to extract n from these two traces?). Still settling down but speed looks to be near V0.10.
So first blush indication is that for stresses 1:1.5:0.67, the resultant edots are 4:9:1. Sounds like a knee. |
.png) |
e=0.0988 | 2305 hrs 5/6. Start of step (3a). Stress level chosen for equal log scale spacing wrt steps (1) and (2). 100:1 gearing is now installed, so upper scale needs to be divided by 10 for comparison purposes. |
.png) |
e=0.0964 | 1353 hrs 5/6. All of step (2b) |
.png) |
e=0.087 | 1006 hrs 5/6. Start of step (2b). Flow returns rapidly to where it was last evening. Presumably the apparent transient in the upper curve here is 100% machine-related, so comparing with previous image should give an indication of sample-related transient. The difference is very subtle. GSS creep theoretically (and usually in practice) has no transient. |
.png) |
e=0.074 | 2045 hrs 5/5, step (2a). Stop here for the night; need to put on a couple more percent strain here, but no interest in arising at 3 a.m. Motor running at V0.09, so apparent n < 2. |
.png) |
e=0.057 | 1523 hrs 5/5. Start of step (2), nice and smooth. edot leveling off near V0.1 at the moment, slightly over twice as fast as step (1), this with a 50% increase in s. Unless we get work softening later on (unlikely), we thus have a clear signal of n≤2. This is very good news in terms of constraining the region of parameter space we have to explore. All other 3% al2o3 runs showed GSS-type weakness, but with n≈4, generally under conditions of increasing stress (an apparent n=4 under conditions of decreasing stress could be blamed on grain growth). We might be able to find the knee and all that it implies. |
.png) |
e=0.051 | 1352 hrs 5/5. End of step (1). |
.png) |
e=0.041 | 0646 hrs 5/5. edot leveling off near 4e-7/s. edot from D etal 2001 Fig. 2 is ~2.3e-7. SD has flow data for 3x P-dropped f.g. ice; will post that info when she sends it to me. |
.png) |
e=0.0182 | 1800 hrs 5/4. Deformation started ~1330 hrs, current edot is somewhere near 5e-7/s, which puts it faster than the pure GSS creep in the 2001 paper. Big difference, not to forget, is that g.s. here is probably smaller. LAS to quantify this shortly, hopefully. And we'll just see where it ends up after a few more percent strain. Some of the work hardening here may be a slightly non-square bottom end of the sample. Given the relatively high edot here, operator skipped the brutal squaring done during inital compaction in previous samples. |